Simple Portfolio Risk Example
Introduction
In this example we take two subject portfolios (see footnote #1) whose constituents are free available via many public venues. The two indexes are the Goldman Sachs Commodity Index (GSCI) and the Bloomberg Commodity Index (BB COM). Both these indexes serve as the basis for many index replication and exchange traded funds (ETFs). Both index purports to capture the key dynamics of the the commodity markets.
This analysis is done on the indexes as they existed on 12/31/2020.
Exposures
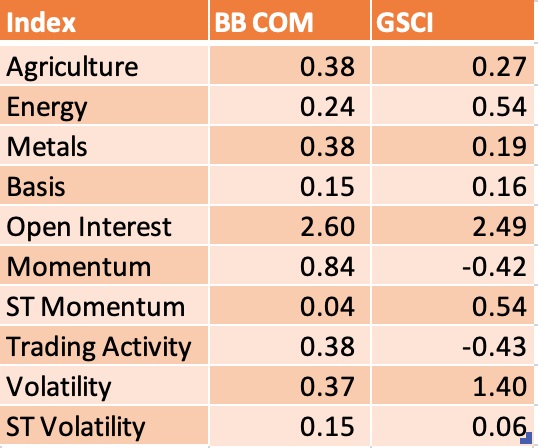
The first step in a risk analysis is a survey of the portfolio exposures. It is interesting that though both seek commodity exposure, they do so in very different ways. First, the BB COM index is overweight in Agriculture and Metals. The GSCI, however, has a very large overweight to Energy. The sector allocations might easy to divine by looking at the portfolio composition. However, were there are stark differences is in the so-called style factor exposures. Here, the funds are radically different. The BB COM index has a good deal of longer term momentum exposure. It is also overweight (both the universe and the competitor) trading activity. The momentum probably stems from the momentum traes in the metals sector and agriculture. The large energy exposure in the GSCI means that the index is short momentum. It is buying what might be loosely termed "value" commodities. These value commodities (in the Energy sector) have had a smart rebound which manifests itself in the positive exposure to short term momentum. Furthermore, we also see this in the very high Volatility exposure.
The exposures gives us the fingerprint of the portfolio. In one glance, using ARC's model, we can clearly separate the differences in the indexes sector and style exposures. It is similar to the fingerprint. We have taken two individuals who look similar. Using their fingerprints, we can clearly tell one from the other!
Risk Decomposition
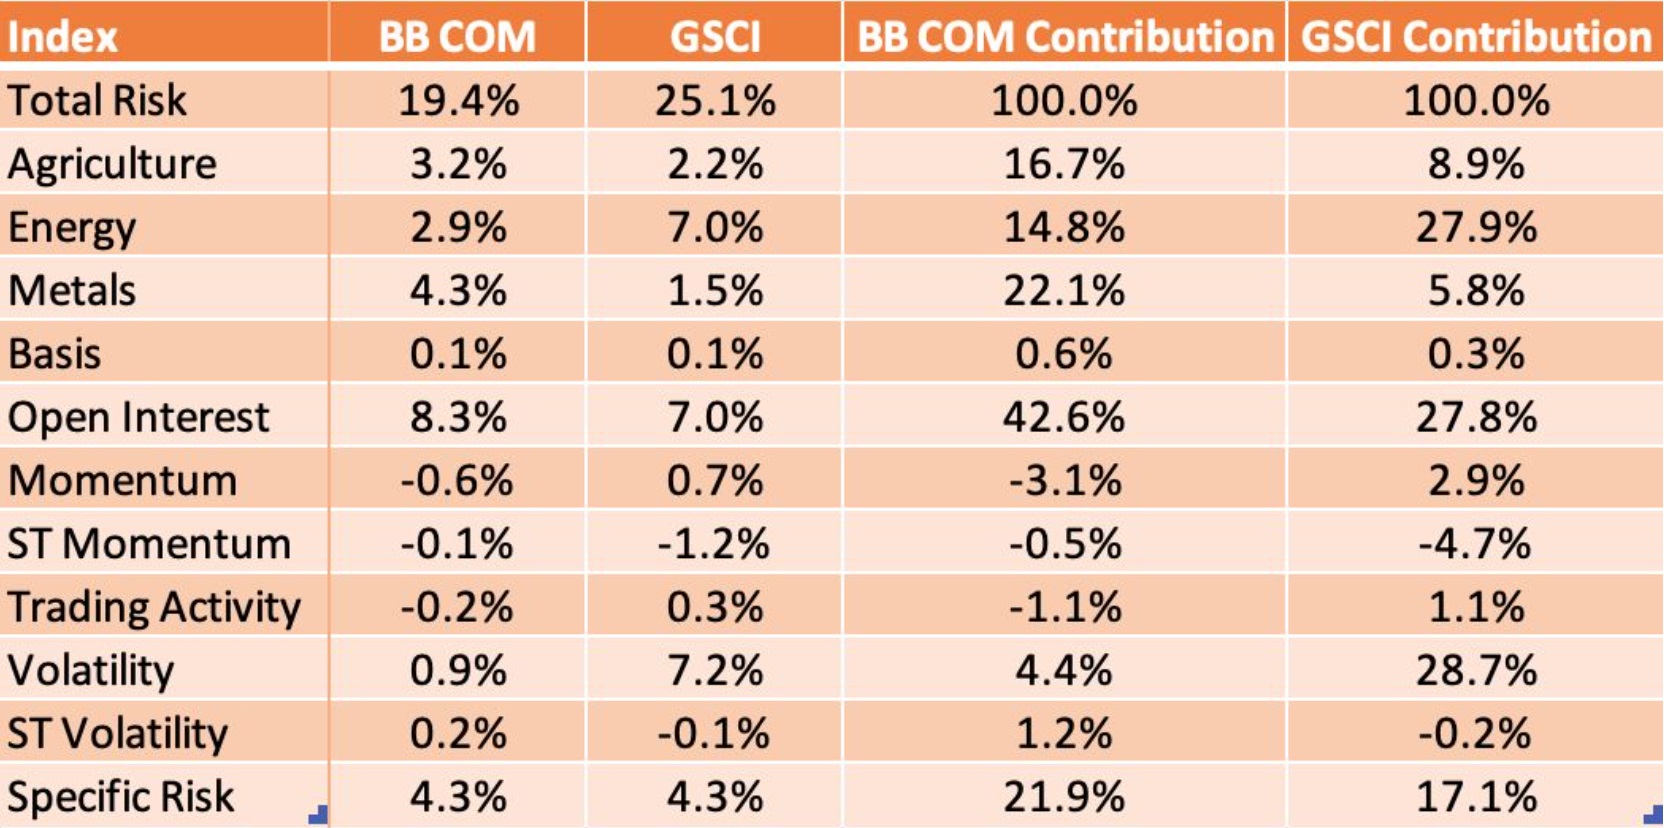
The next step is a risk attribution. Using the exposures above, the ARC model's covariance matrix and its estimates of idiosyncratic risk, we generate an expected total volatility for each fund (the two columns maked BB COM and GSCI, respectively). We also the calculate the % contribution of risk (the last two columns).
Using the model, we find an expected (see footnote #2) volatility of 19.4% for the BB COM and 25.1% for the GSCI. For BB COM we see that the top expected risk contributors are Open Interest, Metals, Agriculture and Energy. The GSCI's top risk accrues in three spots; Volatility, Energy and Open Interest. Both funds have 4.3% specific risk. This is risk that is unrelated to systemic factors (sectors and styles).
Recall that the risk decomposition is the result of several factors. There is exposure, then there is the volatility of an investment and finally there is the correlation offset (or accrual). We see that in both funds Open Interest is a big risk. Both of these indexes have a strong preference for the contracts which have large open interest. However, note that the GSCI index mitigates some of this risk through correlation offsets.
Conclusion
In this illustration of one of the use cases of a factor model, we show that there are significant differences in exposures between two "similar" indexes. The differences in exposures drive some of the differences in risk attribution, but the structure of the GSCI index manages to whittle away some of the risk and present a somewhat less concentrated risk exposure.
Factor models are great at taking a heterogeneous portfolio and projecting it into something more manageable and understandable. We would be very excited to do a similar for a portfolio you might be contemplating. Please get in touch! We think that even the most seasoned PM can learn something new about their portfolio once you put it under the lens of the ARC Commodity Model!
Footnotes
1. Nothing in this example is intended to disparage or otherwise impair either of these indexes. ARC makes no determination as to whether either index is suitable for investment nor whether one index is superior to the other. This discussion merely takes ARC's model and contrasts the two indexes under the spotlight of the model. ARC has no relationship with either index's calculation agent, organizer or promoter. These indexes are the sole property of their respective owner/promoter.
2. Expected, forecast and so forth are predictions. They are the results of using a factor model. As a result, all of these numbers are best understood as best guesses given all of the data available and through the use of a factor model. Every model is an abstraction on reality. Please read our disclaimer for a further discussion of the limitations and conditions when you are browsing this content.